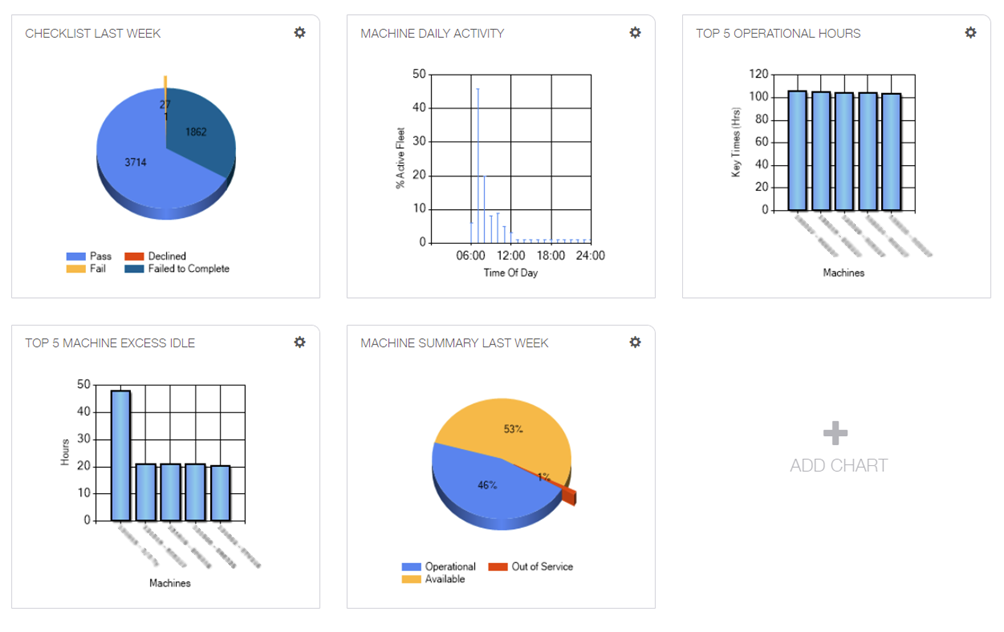
The SmarTrack dashboard allows you to monitor your fleet with visual aids like pie charts and bar graphs, where the data from events is displayed to help you understand more about your machine’s operating behaviour and whether or not operator training or changes need to be made to site.
Dashboards can be personalised and edited by pressing the settings gear icon on a chart / graph. Charts and graphs can also be clicked to be taken to the full report which can be exported in many formats.